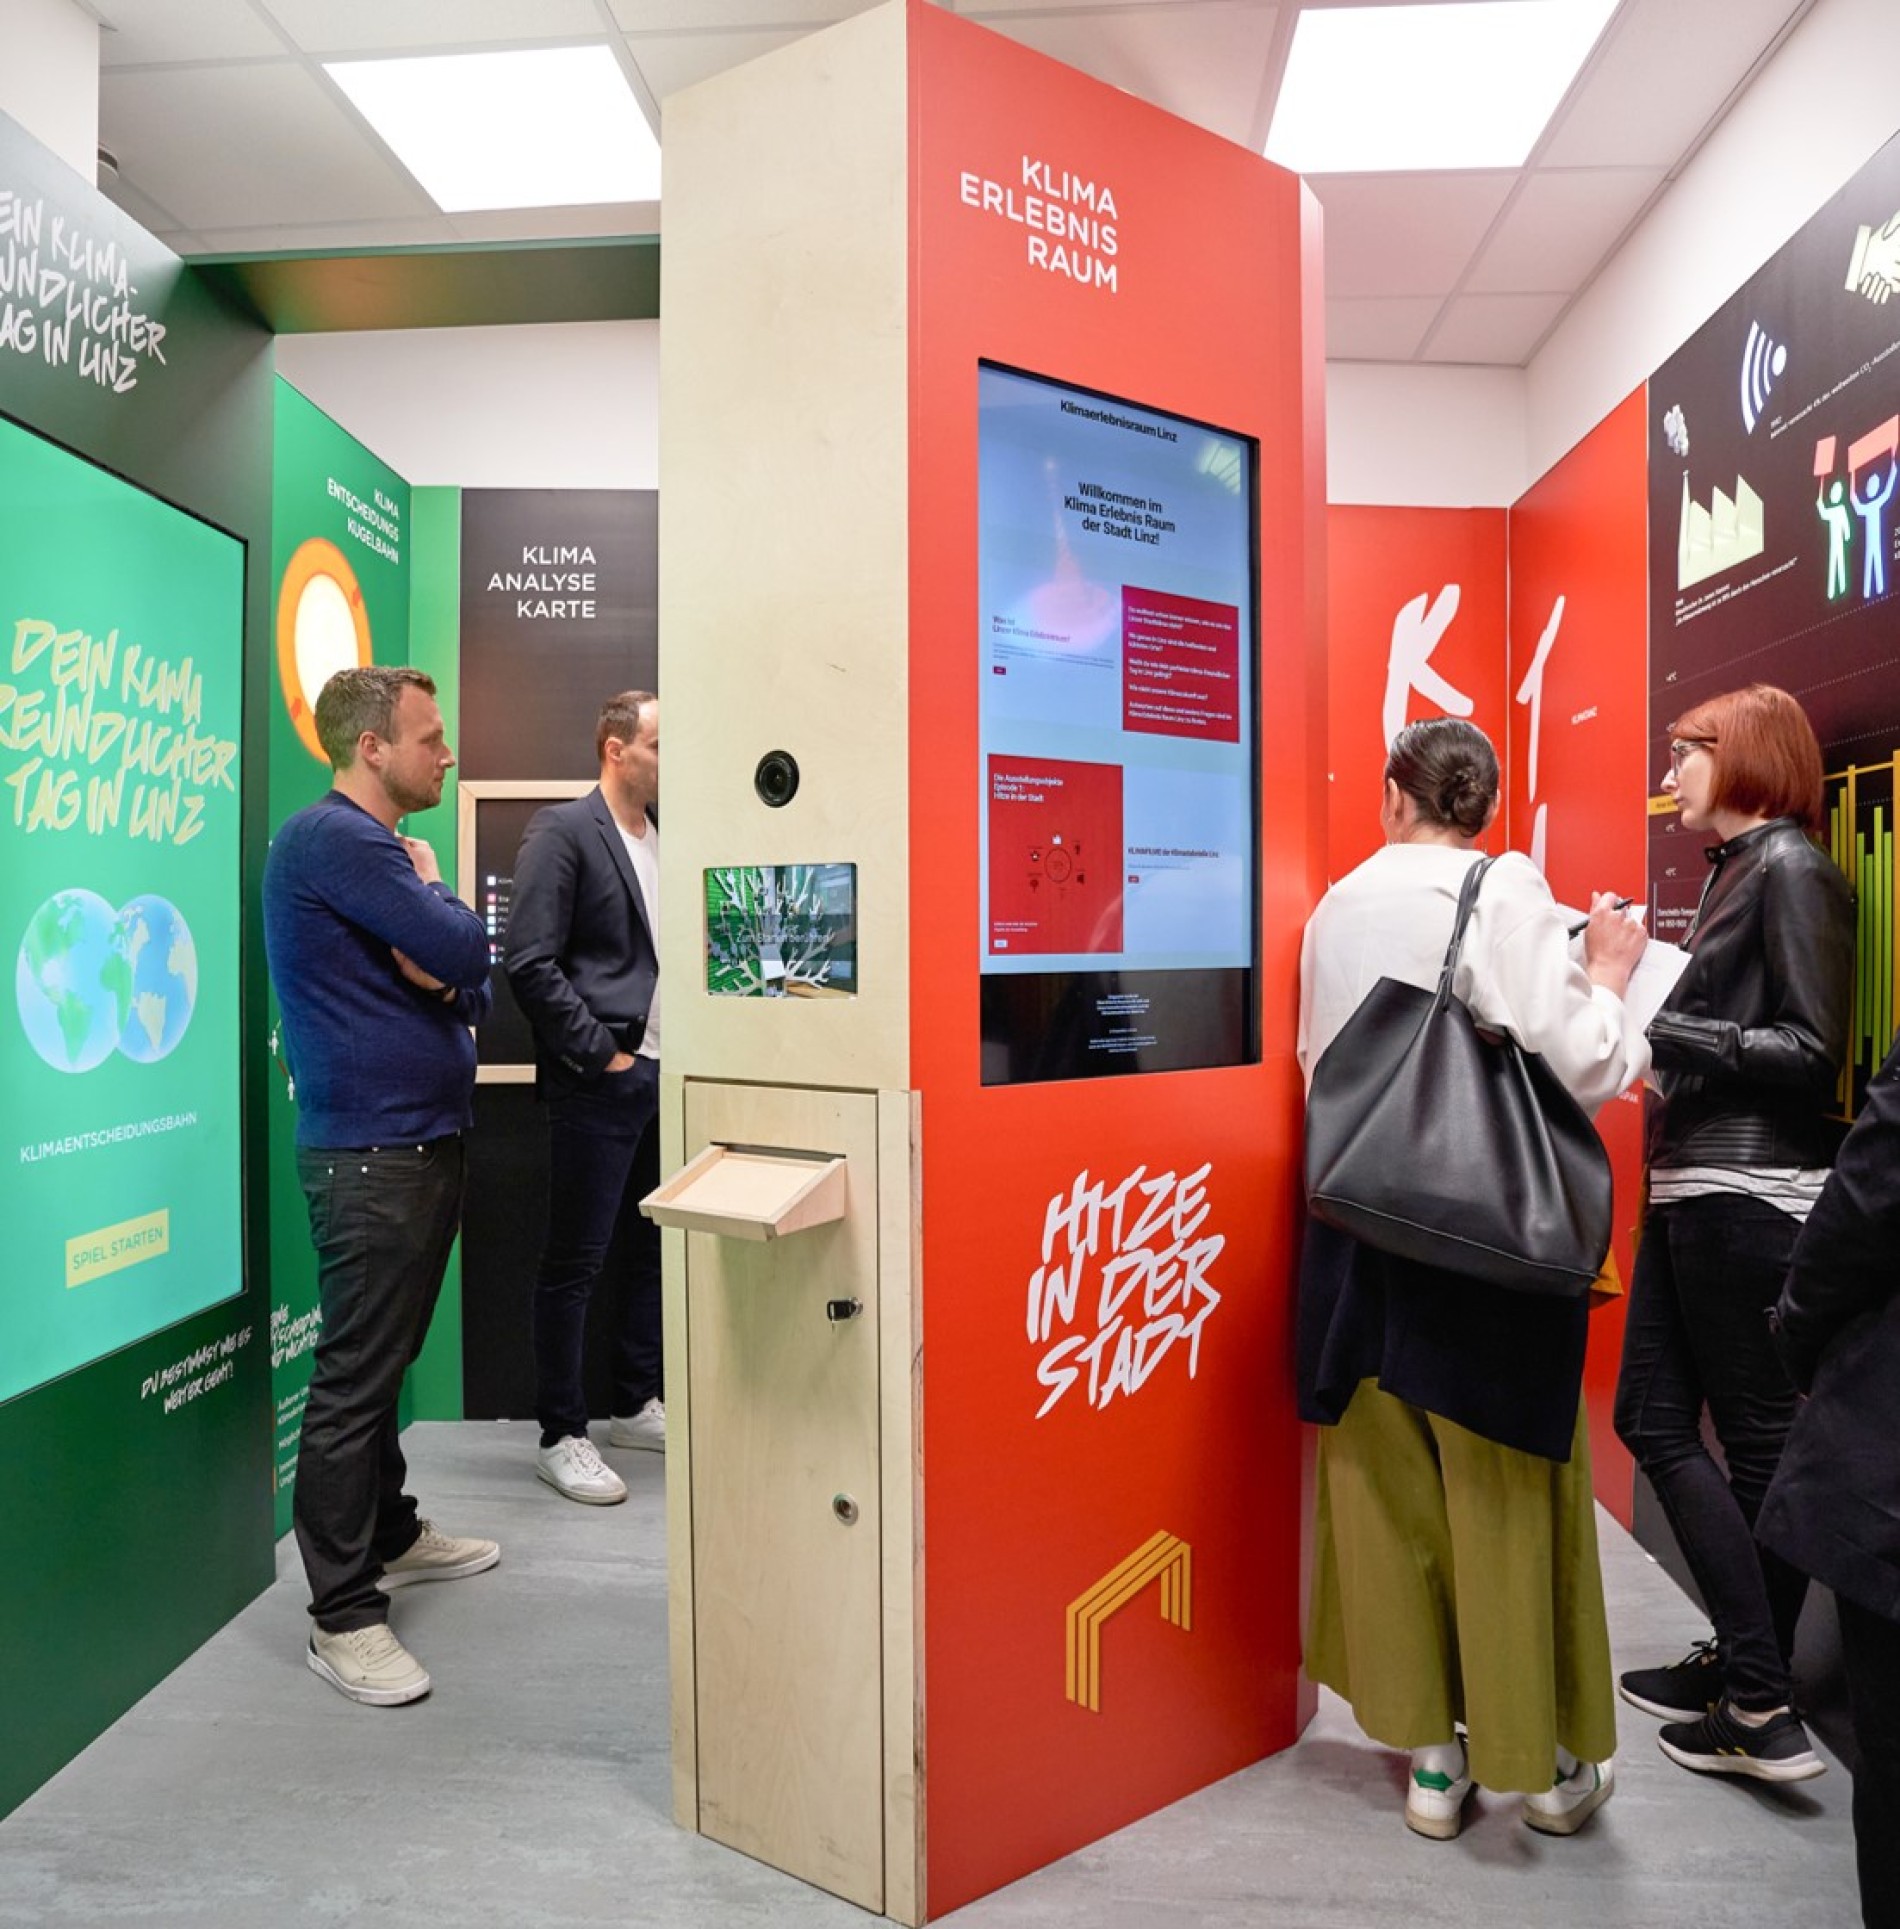
Info Panel
The overview page shows you the course of the exhibition. You can also watch the five stirring Linz climate films. The latter were made by sustainability expert Christian Neuwirth (ib:neuwirth) and moviemaker Markus Kaiser-Mühlecker (KM FILM) and were supported by the Climate Fund of the City of Linz. More information on the climate movies can be found at: Climate movies
Climate Strip
The climate stripes show how much the average temperature in the city of Linz has changed over the last 200 years. If a single year has been warmer on average than the average in the comparison period 1971-2000, the corresponding strip is coloured red; if it has been cooler, it is coloured bluish. This means that the deviations are shown. The four hottest years in Linz were experienced in the last six years. The stripes also show the important 1.5 degree target of the Paris Climate Agreement.
The climate strip graphic also includes the sun graphic. It shows the effects on humans and nature of a global warming of +1.5°C to +6°C. For more information on the climate stripes of the city of Linz, go to: City Climate of Linz
Climate Dance
A large monitor explains what the Climate Dance is about. The dance starts after entering a name and has its own tutorial that explains the further steps in more detail. In this installation, the climate stripes are the associated dance template. Depending on the Climate Stripes and the level, the intensity of the dance increases and the body heats up constantly. This allows you to experience the incredible speed of climate heating on your own body. At the end of the level, points are awarded and you can leave your name on the "Wall of Fame".
Climate analysis map
This installation shows where the hottest and coldest places are in Linz. Where fresh air is generated and which factors cool the city and which warm it. The climate analysis map thus identifies areas with similar climate characteristics (so-called climatopes), such as areas where cold air originates and areas with strong overheating. The climate analysis map is part of the Linz City Climate Analysis. More information on the city climate analysis can be found at: Climate analysis map
Ball track: A climate-friendly day in Linz
A large ball game hangs on the wall. On the basis of a decision tree, a climate-neutral day is to be designed. Depending on which decisions are made, the ball takes a different course. If the decision is positive in terms of climate protection, the colouring is a friendly green. If, on the other hand, the decision is negative in terms of climate protection, the colouring is reddish. The installation is linked to a stress graphic, which shows the internal (e.g. through poverty and inequality) and external effects (e.g. climate crisis, species extinction) of stress factors. Depending on your decisions, a good and sustainable life becomes possible, or life becomes difficult or impossible.
LEAF a Message (Sponsored by LINZ AG)
Here you will find a photo box and blank A5 sheets of paper. On the sheets you can leave a climate wish and tell the city of Linz what you think needs to be done in the future to make a climate-friendly and good life possible for everyone. In addition to the message, you can take a photo, which you can later take home as a souvenir. The written message will in turn be hung on the tree. The climate wish tree is located opposite the photo box. www.linzag.at